A/B test sample size calculator
Find out how many visitors an A/B test needs before you start it. Enter today's conversion rate, the smallest lift worth finding, and your daily traffic to get the visitors each version needs, how many days that takes, and the formula with your numbers in it.
Visitors per version
53,211
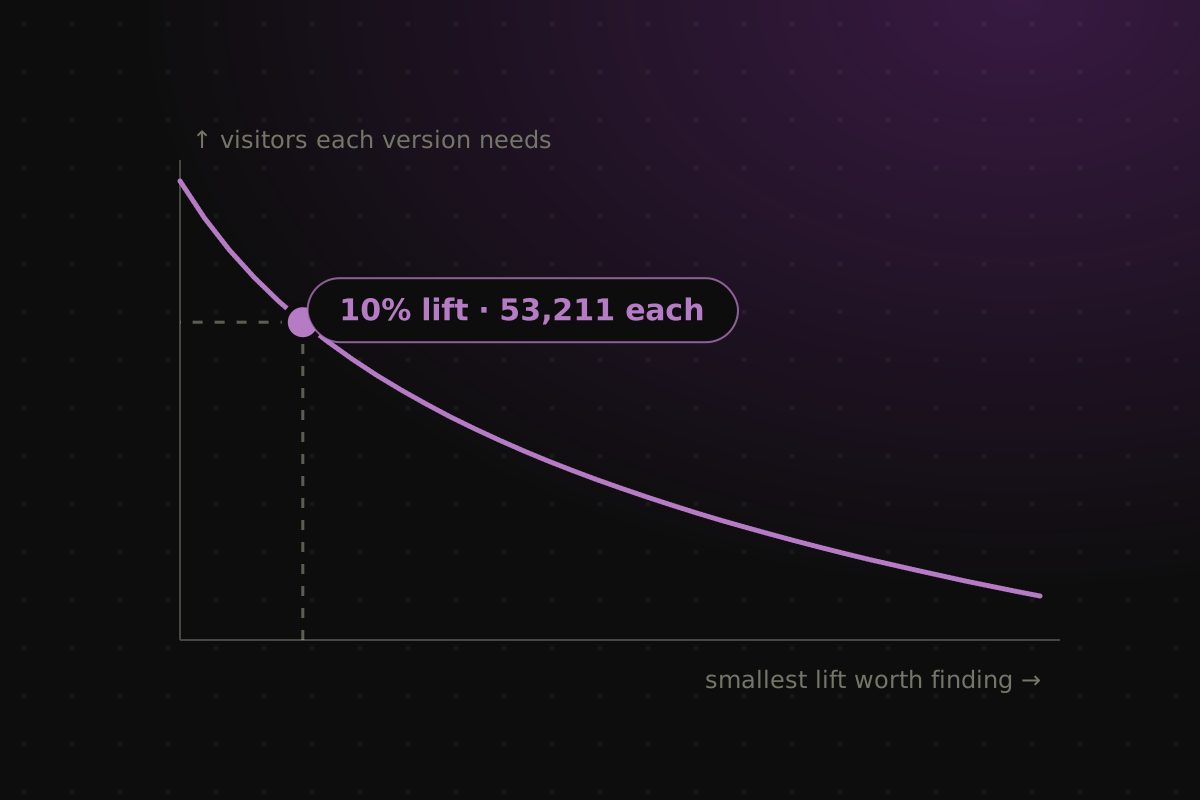
To catch a 10% lift (3% to 3.3%) at 95% significance and 80% power, each version needs 53,211 visitors: 106,422 in all.
At 1,000 visitors a day to each version, that’s 54 days. Plan 8 full weeks, so every weekday counts equally.
Stop only when both versions reach this number, then check the result for significance.
The formula with your numbers
Two-sided, two-proportion z-test with an even split. p₁ is today’s rate, p₂ the rate you want to detect, p̄ their average.n = (zα/2√(2p̄(1−p̄)) + zβ√(p₁(1−p₁) + p₂(1−p₂)))² ÷ (p₂ − p₁)²
zα/2 = 1.960, zβ = 0.842, p₁ = 0.0300, p₂ = 0.0330, p̄ = 0.0315 → n = 53210.3, rounded up to 53,211
| Lift | Rate change | Visitors each | Days |
|---|---|---|---|
| 5% | 3% → 3.15% | 207,938 | 208 |
| 10% | 3% → 3.3% | 53,211 | 54 |
| 15% | 3% → 3.45% | 24,193 | 25 |
| 20% | 3% → 3.6% | 13,914 | 14 |
| 30% | 3% → 3.9% | 6,455 | 7 |
Start A/B tests for free. Replo splits your traffic between two versions of a page and tells you which one sells more.
How to read your number
Sample size is the number of visitors each version has to see before you call the test. At a 3% conversion rate, catching a 10% lift (3% to 3.3%) at 95% significance and 80% power takes 53,211 visitors per version. At 1,000 visitors a day to each version, that's 54 days, so plan 8 full weeks.
Why it matters
A test stopped before it reaches its sample size picks winners by luck. Sizing it first tells you whether your traffic can answer the question at all, and if it can't, to test a bolder change or a busier page instead of waiting months for a result.
Formula
n = (z(α/2) × √(2p̄(1 − p̄)) + z(β) × √(p₁(1 − p₁) + p₂(1 − p₂)))² ÷ (p₂ − p₁)²
n is the visitors each version needs, p₁ today's conversion rate, p₂ the rate you want to detect, and p̄ their average. z(α/2) is 1.96 at 95% significance (two-sided) and z(β) is 0.84 at 80% power. It's the standard two-proportion z-test formula with an even split, as in Fleiss, Levin and Paik and R's power.prop.test.
New to the term? Read what A/B testing means.
Other ways to calculate A/B test sample size
- Relative minimum detectable effect
- p₂ = p₁ × (1 + MDE)
- The usual way to set it: a 10% MDE on a 3% rate means 3% becoming 3.3%. Most testing tools ask for this.
- Absolute minimum detectable effect
- p₂ = p₁ + MDE
- When you think in percentage points: a 0.5-point MDE on 3% means 3% becoming 3.5%, a 16.7% relative lift.
- Test length
- Days = n ÷ visitors a day to each version, rounded up to whole weeks
- With a 50/50 split, each version gets half the page's traffic. Round up to whole weeks so weekdays and weekends count equally.
- Quick rule of thumb
- n ≈ 16 × p̄(1 − p̄) ÷ (p₂ − p₁)²
- Lehr's shortcut for 95% significance and 80% power. Close to the full formula for small lifts; use the calculator for the exact number.
What is statistical power?
Statistical power is the chance a test catches a real lift of the size you planned for. At 80% power, if the new version truly converts 10% better, the test calls it a winner 4 times in 5; the fifth time it misses.
Significance guards the other side: at 95%, a version that is no better gets called a winner at most 1 time in 20. Raising either one makes the test more reliable and needs more visitors. Going from 80% to 90% power at a 3% rate and a 10% lift takes 71,233 visitors per version instead of 53,211.
How to pick a minimum detectable effect
- Start from what would change your plans. If a 5% lift wouldn't be worth shipping the new page, don't size the test for it.
- Check it against your traffic. The table in the calculator shows the visitors each lift needs. If the lift you want takes longer than about 8 weeks, test a bigger change.
- Test bolder changes on smaller pages. Halving the lift you want to catch roughly quadruples the visitors you need.
- Decide before the test starts. Choosing the lift after seeing results turns the plan into a guess.
How to calculate A/B test sample size: a worked example
A product page converts at 3%. The store wants to know whether a new hero lifts that by 10%, to 3.3%, at 95% significance and 80% power, with 2,000 visitors a day split evenly.
- p₁ = 0.03, p₂ = 0.033, p̄ = 0.0315; z(α/2) = 1.960 for 95% significance and z(β) = 0.842 for 80% power
- 1.960 × √(2 × 0.0315 × 0.9685) = 0.4841
- 0.842 × √(0.03 × 0.97 + 0.033 × 0.967) = 0.2079
- (0.4841 + 0.2079)² = 0.4789, and (0.033 − 0.03)² = 0.000009
- n = 0.4789 ÷ 0.000009 = 53,210.3, rounded up to 53,211 visitors per version
- 53,211 ÷ 1,000 visitors a day to each version = 54 days, so 8 full weeks
The test needs 106,422 visitors in all and about two months. If that's too long, sizing for a 20% lift instead takes 13,914 visitors per version: 14 days, or 2 full weeks.
How many visitors does an A/B test need?
It depends most on two things: today's conversion rate and the lift you want to catch. Lower rates and smaller lifts both need more visitors. The table shows visitors per version at 95% significance and 80% power, from the formula above.
As a check, these match R's power.prop.test, the standard reference for this formula: for 50% against 75% at 90% power it gives 76.7 per group, as this calculator does.
| Current conversion rate | 5% lift | 10% lift | 20% lift | 30% lift |
|---|---|---|---|---|
| 1% | 637,010 | 163,095 | 42,693 | 19,827 |
| 2% | 315,206 | 80,682 | 21,109 | 9,798 |
| 3% | 207,938 | 53,211 | 13,914 | 6,455 |
| 5% | 122,124 | 31,234 | 8,158 | 3,780 |
| 10% | 57,763 | 14,751 | 3,841 | 1,774 |
After you size it: run it, then check it
- Run whole weeks, and don't stop early. Checking daily and stopping at the first 95% inflates false winners.
- Keep the split even and the page unchanged. An uneven split or a mid-test edit breaks the plan.
- Check the result once both versions reach n. Paste each version's visitors and conversions into the statistical significance calculator.
- Run the test where you build the page. A/B testing in Replo splits visitors between two versions of a page on one link, with the result next to your sales.
Questions about A/B test sample size
- How do you calculate sample size for an A/B test?
- Use the two-proportion formula: add 1.96 × √(2p̄(1 − p̄)) and 0.84 × √(p₁(1 − p₁) + p₂(1 − p₂)), square the sum, and divide by the gap between the two rates squared. That's 95% significance and 80% power; the calculator does it for any settings.
- What is a minimum detectable effect?
- The minimum detectable effect (MDE) is the smallest lift a test is sized to catch reliably. A 10% MDE on a 3% conversion rate means 3% becoming 3.3%. Smaller effects need far more visitors, so pick the smallest lift that would change what you do.
- How long should an A/B test run?
- Until each version reaches its sample size, rounded up to whole weeks, and never less than one week. Divide the visitors per version by the daily visitors each version gets. At 1,000 a day each, a 53,211 sample takes 54 days, so plan 8 weeks.
- What is statistical power in an A/B test?
- Power is the chance a test detects a real lift of the size you planned for. 80% is the common default: a real 10% lift gets caught 4 times in 5. Raising it to 90% needs about a third more visitors.
- Should I use 90%, 95% or 99% significance?
- 95% is the usual default. Use 99% for changes that are costly to undo, such as prices, and plan about 50% more visitors. 90% suits quick, cheap-to-reverse tests, with about 20% fewer visitors and more false winners.
- Why does my testing tool give a different number?
- Tools differ in method. Some use one-sided tests or sequential statistics, such as Optimizely's stats engine, and some round differently. This calculator uses the fixed-horizon, two-sided test most textbooks teach, and matches R's power.prop.test, the standard reference.
- Can I test more than two versions?
- Yes, but each version needs the full sample size, and each extra one adds a chance of a false winner. With three versions, plan three times n visitors and consider a stricter significance level, or test two at a time.
Sources
Experiments
A/B test your pages in Replo
Split traffic between two versions of a Replo page and see which one sells, with the result next to your sales.