Statistical significance calculator for A/B tests
Did your new page really sell better, or was it luck? Enter each version's visitors and conversions to see whether the gap is real, then plan how many visitors your next test needs.
Check a finished test
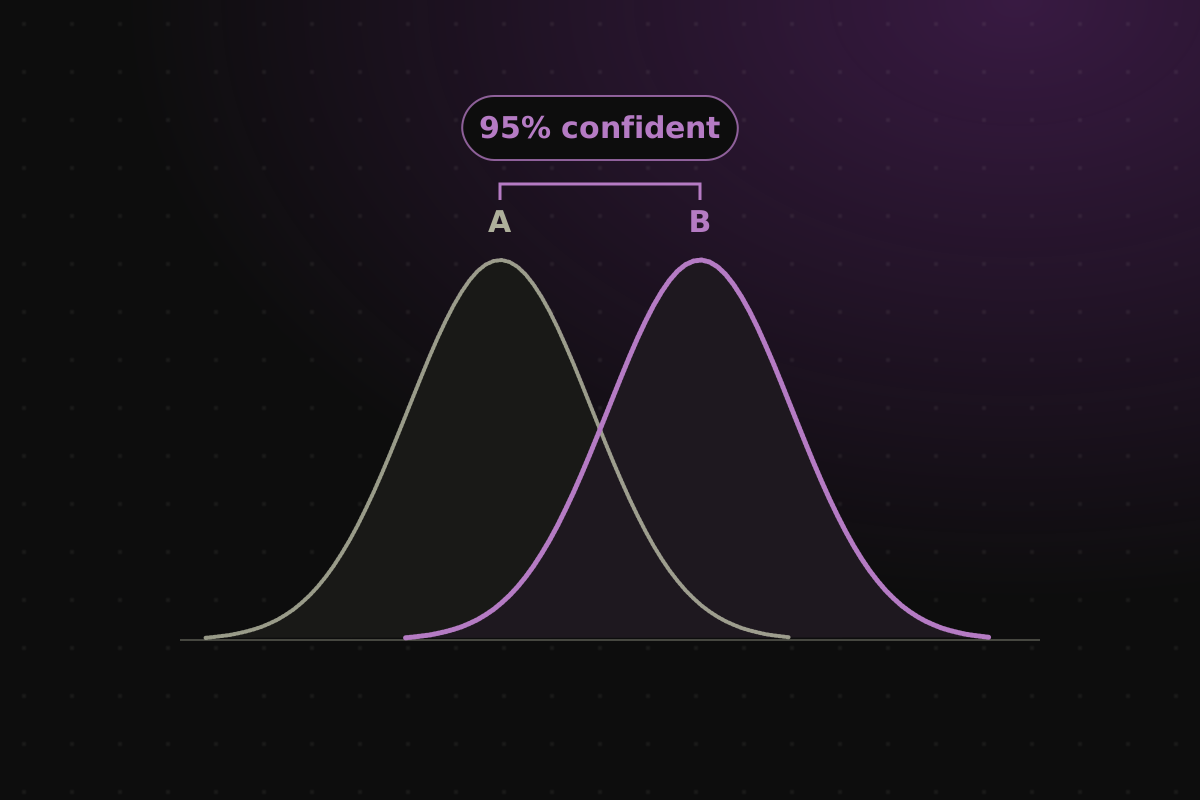
Did the new version really sell better, or was it luck? Enter each version’s visitors and orders. The less the two curves below overlap, the likelier the difference is real.
ControlThe control is the page you already had (version A). The variant is the new version you’re testing (version B).: visitors, conversionsA conversion is a visitor who did what you’re testing for, usually placing an order. Use the same goal for both versions. · 3.00%
Variant: visitors, conversions · 3.80%
- Control 3.00%
- Variant 3.80%
- Overlap: rates both versions could really have
Chance the variant beats the controlHow likely the variant’s true conversion rate is the higher one, read off the two curves. 97.5% here matches the usual 95% significance bar.
98.6%
SignificantThe variant converts 26.7% better than the control, and a gap this size is unlikely to be chance (p < 0.05).
- Confidence (two-sided)1 minus the p-value. At 95% or more the result is called statistically significant: a gap this big would rarely happen by chance alone.
- 97.27%
- p-value and z-scoreThe p-value is how often you'd see a gap this big if both versions truly converted the same; under 0.05 is the usual bar. The z-score is the gap measured in standard errors; beyond ±1.96 is significant.
- 0.0273 · z = 2.21
- 95% interval for the gapThe range the real difference in conversion rate probably sits in, in percentage points. If it stays above zero, the variant likely wins.
- +0.09 pts to +1.51 pts
Plan a test: sample size and length
Before you start a test, find out how many visitors it needs. The smaller the improvement you want to catch, the more traffic it takes to tell it apart from luck.
A page converting at The share of visitors who buy on this page today. Most online stores: 2 to 3%. with visitors a day, looking for a lift of The minimum detectable effect: the smallest improvement the test can reliably catch, relative to today’s rate. 10% means 3% becoming 3.3%. Most stores plan for 10 to 20%..
- 10% lift: 53,211 visitors per version
- Dotted lines: visitors per version that whole weeks of your traffic reach
- Across: smallest lift worth finding, 2% to 50%
Visitors per versionThe sample size: how many visitors each version has to see before you call the test. Stop only once both reach it.
53,211
To catch a 10% lift on a 3% rate, each version needs 53,211 visitors: about 54 days at 2,000 a day split two ways. Run at least 7 days so weekdays and weekends both count, and don't stop early when one version pulls ahead.
In four weeks your traffic can reliably catch lifts of 14% or more.
Two-sided, 95% significance and 80% power, the settings most testing tools default to.95% significance means a false winner shows up at most 1 time in 20. 80% power means a real lift of your size gets caught 4 times in 5.
See where shoppers click for free. Replo records where visitors click and how far they scroll, so you know what to fix first.
Formula
Statistical significance tells you how unlikely an A/B test's gap would be if the two versions really converted the same.
z = (p₂ − p₁) ÷ √(p(1 − p)(1/n₁ + 1/n₂))
This is a two-tailed, two-proportion z-test. p₁ and p₂ are the two conversion rates, n₁ and n₂ the visitors, and p the pooled rate. The p-value comes from the normal distribution; the 95% interval uses each version's own rate. Sample sizes use the standard two-proportion formula at 95% significance and 80% power.
New to the term? Read what A/B testing means.
How to read the result
- Chance the variant beats the control is the probability the variant's true rate is the higher one, worked out from the two curves on the chart. It's one-sided, so 97.5% lines up with the usual 95% two-sided bar.
- Confidence is 1 minus the p-value. At 95% or above, the calculator calls the result significant.
- The p-value is how often you'd see a gap at least this big if the two versions truly converted the same. Below 0.05 is the usual bar.
- The 95% interval is the range the real gap in conversion rate probably sits in. If it runs from just above zero to well above it, the variant likely wins, but maybe by less than the headline lift.
A significant result tells you the gap is probably real. It doesn't tell you the gap is big enough to matter, so read the interval as well as the verdict.
How to calculate statistical significance: a worked example
A store tests its product name as the headline (control) against the hook from its best ad (variant), with a 50/50 split.
- Control: 5,000 visitors, 150 orders, a 3.0% conversion rate
- Variant: 5,000 visitors, 190 orders, a 3.8% conversion rate
- The variant converts 26.7% better; p = 0.027 and z = 2.21
- The interval for the gap runs from +0.09 to +1.51 points
The variant very likely wins, but the true lift could be much smaller than 26.7%. With 170 orders on the variant instead (3.4%), p = 0.26: that 13% lift could easily be chance.
How many visitors a test needs
The smaller the lift you want to detect, the more visitors you need; the A/B test sample size calculator adds significance, power and the formula with your numbers. At a 3% conversion rate, finding a 10% lift takes 53,211 visitors per version; finding a 20% lift takes 13,914.
At 2,000 visitors a day split across two versions, that's about 54 days or 14 days. The table gives more starting points, all at 95% significance and 80% power.
Most stores stop sooner: half of the thousands of finished tests on Replo ended within a week. See what stores A/B test and how long tests run.
| Current conversion rate | To find a 10% lift | 20% lift | 30% lift |
|---|---|---|---|
| 1% | 163,095 | 42,693 | 19,827 |
| 2% | 80,682 | 21,109 | 9,798 |
| 3% | 53,211 | 13,914 | 6,455 |
| 5% | 31,234 | 8,158 | 3,780 |
Five ways to fake a winner
- Stopping when it first hits 95%. Confidence swings early. Decide the sample size first and stop when you reach it.
- Running less than a week. Weekend shoppers behave differently. Run whole weeks.
- An uneven split. If a 50/50 test ends at 5,400 vs 4,600 visitors, something in the setup is broken. Fix it before you trust the result.
- Too many versions. Each extra version is another chance of a false winner. Test two, or raise the bar.
- Changing the page mid-test. Any edit restarts the clock.
Run the test where you build the page
A/B testing on Replo sites splits traffic between two versions of a page; check the result here. Theme Builder, Replo's Shopify page builder, has A/B testing built in for pages in your theme today. See A/B testing with Replo for how it works.
Questions about statistical significance
- What is statistical significance?
- Statistical significance means a result is unlikely to be chance. In an A/B test, a significant result at 95% means a gap as big as yours would show up less than 5% of the time if both versions really converted the same. It says the gap is probably real, not that it's big.
- How do you calculate statistical significance for an A/B test?
- Use a two-proportion z-test. Work out each version's conversion rate, divide the gap by its standard error to get a z-score, then turn the z-score into a p-value. A z-score beyond ±1.96 (p below 0.05) is significant at 95%. The calculator above does all of it from visitors and conversions.
- What p-value counts as significant?
- Below 0.05, which this calculator shows as 95% confidence or more. For a change that's costly to undo, such as a price, use a stricter bar like 0.01, and plan a bigger sample to match.
- What is a minimum detectable effect?
- The minimum detectable effect (MDE) is the smallest lift a test can reliably catch, set before the test starts. A 10% MDE on a 3% conversion rate means the test is sized to spot 3% becoming 3.3%. A smaller MDE needs far more visitors, so pick the smallest lift that would change what you do. The A/B test sample size calculator shows how many.
- How long should an A/B test run?
- Until each version reaches the sample size you planned, and for at least one full week, so weekdays and weekends both count. At low traffic, test bigger changes: a 20% lift needs about a quarter of the visitors a 10% lift does.
- Can I stop my test as soon as it reaches 95%?
- No. Checking every day and stopping at the first 95% inflates false winners. Decide the sample size before you start with the planner above, and call the test only when both versions reach it.
- Can I use this with the testing tool I already have?
- Yes. Paste the visitors and conversions from any tool, such as Intelligems, VWO or Shopify Rollouts, and the math is the same. Those tools still work with pages you build in Replo.
Experiments
A/B test your pages in Replo
Split traffic between two versions of a Replo page and see which one sells, with the result next to your sales.