Add to cart rate by industry
Median add to cart rate for 18 industries in 2026, measured on real sessions at thousands of stores built on Replo over the 90 days to November 14, 2026.
The short answer
The median online store adds to cart in 4.9% of sessions, and the middle half of stores land between 3.0% and 7.3%. Food and drink stores add to cart in 5.6%, health and beauty in 5.4% and apparel in 4.8%, while home and garden sits at 4.1% and furniture at 2.7%. A good add to cart rate beats your own industry's median.
To see yours by page, build your store with Replo and sell through Replo checkout: every page reports sessions, adds to cart and orders.
Furniture stores get half the adds to cart of food stores
The median store adds to cart in 4.9% of sessions. Cheap things people reorder sit near 5.5%; big, considered purchases near 3%.
- Religious and ceremonial5.7%
- Food and drink5.6%
- Luggage and bags5.6%
- Office supplies5.4%
- Health and beauty5.4%
- Pet supplies5.1%
- All stores4.9%
- Apparel and accessories4.8%
- Baby and toddler4.6%
- Toys and games4.6%
- Arts and hobbies4.6%
- Books and media4.5%
- Electronics4.4%
- Home and garden4.1%
- Business and industrial3.8%
- Sporting goods3.7%
- Auto parts3.5%
- Hardware and tools3.0%
- Furniture2.7%
Sessions with at least one add to cart ÷ all sessions for each store, then the median store. Every industry shown has 20 or more stores. Cameras and optics and Mature are left out: fewer than 20 stores.
| Industry | Stores | Add to cart rate | Top quarter adds | Conversion rate |
|---|---|---|---|---|
| Religious and ceremonial | 30+ | 5.71% | 8.12%+ | 2.36% |
| Food and drink | 700+ | 5.59% | 8.23%+ | 2.33% |
| Luggage and bags | 30+ | 5.58% | 6.78%+ | 1.61% |
| Office supplies | 20+ | 5.44% | 6.74%+ | 2.04% |
| Health and beauty | 2,200+ | 5.38% | 7.95%+ | 2.18% |
| Pet supplies | 250+ | 5.10% | 7.18%+ | 2.33% |
| Apparel and accessories | 700+ | 4.75% | 6.93%+ | 1.38% |
| Baby and toddler | 40+ | 4.64% | 5.94%+ | 1.49% |
| Toys and games | 80+ | 4.61% | 6.55%+ | 1.53% |
| Arts and hobbies | 60+ | 4.56% | 6.26%+ | 1.29% |
| Books and media | 60+ | 4.45% | 6.54%+ | 1.86% |
| Electronics | 100+ | 4.43% | 6.26%+ | 1.26% |
| Home and garden | 500+ | 4.07% | 6.35%+ | 1.51% |
| Business and industrial | 50+ | 3.81% | 5.35%+ | 1.56% |
| Sporting goods | 250+ | 3.71% | 5.44%+ | 1.31% |
| Auto parts | 60+ | 3.53% | 5.40%+ | 1.06% |
| Hardware and tools | 40+ | 3.03% | 5.01%+ | 0.80% |
| Furniture | 50+ | 2.71% | 3.75%+ | 0.46% |
| All stores | Thousands | 4.89% | 7.34%+ | 1.87% |
Add to cart rates vary much less by industry than conversion rates do. Conversion rate and its spread for each industry are in ecommerce conversion rate by industry, and order value in average order value by industry.
Inside the biggest industries
Skincare and makeup stores get more adds to cart than supplement stores, and household supplies more than kitchen and dining.
| Store type | Industry | Stores | Add to cart rate |
|---|---|---|---|
| Household supplies | Home and garden | 60+ | 7.08% |
| Personal care (skincare, makeup, hair) | Health and beauty | 1,000+ | 6.24% |
| Food | Food and drink | 350+ | 5.70% |
| Clothing | Apparel and accessories | 200+ | 5.21% |
| Drinks | Food and drink | 300+ | 5.18% |
| Shoes | Apparel and accessories | 70+ | 5.11% |
| Health care (supplements, vitamins, wellness) | Health and beauty | 1,200+ | 4.86% |
| Kitchen and dining | Home and garden | 70+ | 4.33% |
Email visits add to cart about 3 times as often as paid social
Visitors who already know you add to cart most. Desktop sessions add to cart in 5.3% and phone sessions in 5.0%.
| Traffic source | Add to cart rate |
|---|---|
| Email and SMS | 11.51% |
| AI assistants | 8.70% |
| Organic search | 8.15% |
| Other tagged links | 7.38% |
| Paid search | 6.19% |
| Affiliates | 5.95% |
| Referral sites | 5.80% |
| Organic social | 4.80% |
| Paid social | 4.02% |
| Direct | 4.00% |
So a store that shifts budget to paid social can see its add to cart rate fall with no change to a single page. Compare each source with its own row.
Pricier stores get fewer adds to cart
We split every industry's stores into four equal groups by order value. The cheapest quarter adds to cart in 6.1% of sessions, the priciest in 3.9%.
| Store's order value in its industry | Add to cart rate |
|---|---|
| Cheapest quarter | 6.12% |
| Second quarter | 5.69% |
| Third quarter | 5.11% |
| Priciest quarter | 3.87% |
| Priciest tenth | 3.36% |
What a product page shows before the button
Three real product pages from industries in the table, as a phone shows them. These brands aren't in the data.

Food and drink · median 5.6%
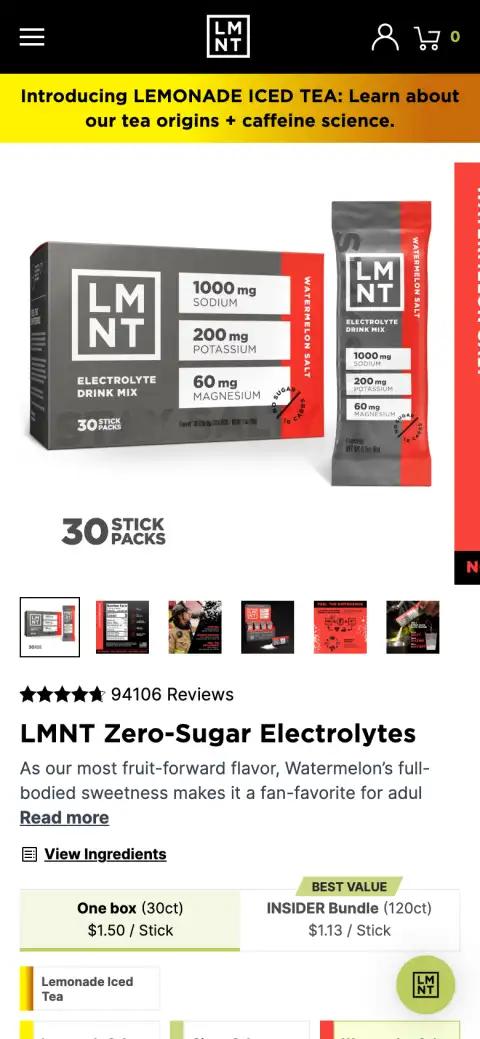
LMNT
Two box sizes and a per-stick price
LMNT's first phone screen shows 94,106 reviews and a choice of one box at $1.50 a stick or a bundle at $1.13. The shopper picks a size, not whether to buy.

Health and beauty · median 5.4%
K18
A buy button that stays on screen
K18's serum page pins an Add to cart bar with the $120 price to the bottom of the phone, so the button never scrolls away while the shopper reads.


Home and garden · median 4.1%
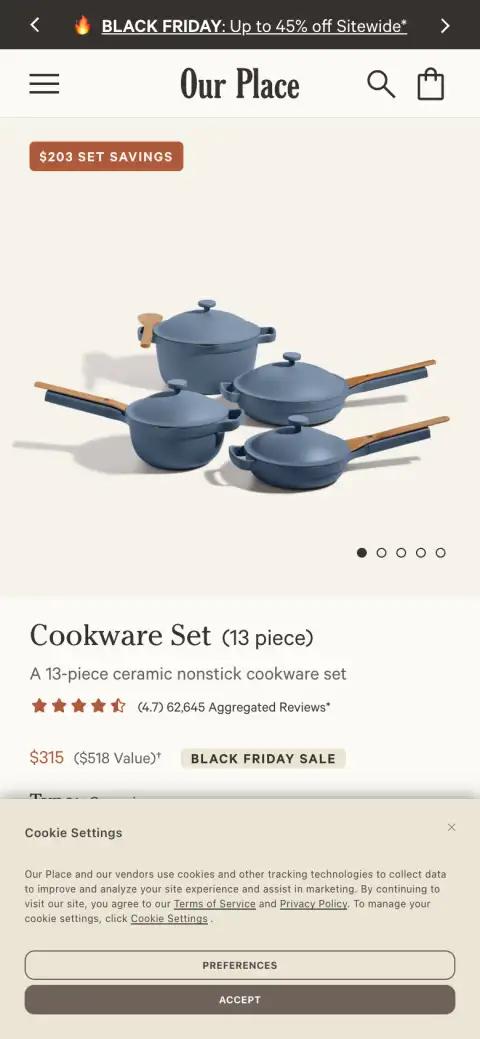
Our Place
The savings before the price
Our Place sells a $315 cookware set in an industry that adds to cart less often. Its first screen shows $203 in set savings, the $518 value and 62,645 reviews.
What to do if your add to cart rate is low
Check these in order. The first two tell you whether the page is the problem at all.
- Compare with your industry and your price, not every store. A $300 product gets fewer adds to cart than a $30 one.
- Split it by traffic source before you change a page. Paid social visits add to cart in 4.0% of sessions at the median store, email visits in 11.5%.
- Put the price, the reviews and the add to cart button on a phone's first screen, where most sessions start.
- Show what's in the box and what it costs per use. A pack size or per-serving price answers the question that stops a cart.
- If you add to cart near your industry but convert below it, fix the cart and checkout before the product page.
- Test one change at a time with an A/B test, and keep the version that brings more orders, not only more carts.
See your adds to cart by page
Replo builds your store and checkout, then reports sessions, carts and orders for every page.



How we counted
- Stores built on Replo whose pages run Replo's analytics, over the 90 days to November 14, 2026. Stores are never named.
- A store counts once it had 1,000 or more sessions and at least one add to cart in the window.
- Add to cart rate is sessions with at least one add to cart ÷ all sessions, per store, then the median store.
- Industry is each store's main product category in Shopify's product taxonomy. An industry shows with 20 or more stores.
- Traffic source and device come from each session's first page. Price quarters need 30 or more orders in 90 days.
- Days when a source and device brought 3 times their usual one-page sessions with no add to cart are removed as suspected bots.
Cite this study
Replo, "Add to cart rate by industry," replo.app/reports/add-to-cart-rate-by-industry
Link to this page when you quote a number.
More studies: average order value by industry and how far shoppers scroll. Work out the numbers after the cart with the cart abandonment rate calculator and the conversion rate calculator.