Average order value by industry
Median order value for 15 industries in 2026, measured on real orders at thousands of stores built on Replo over the 90 days to November 14, 2026.
The short answer
The median online store's average order value is $79, and the middle half of stores take $56 to $128. It runs from $59 in books and media, $66 in food and drink and $72 in health and beauty, to $103 in apparel, $117 in home and garden and $505 in furniture. A good AOV is one above your own industry's median that doesn't cost you conversion rate.
A furniture order is worth about 9 times a book order
The median store's order is $79. Industries that sell things people reorder, like food, pet supplies and beauty, take the smallest orders; furniture and hardware take the largest.
- Furniture$505
- Hardware and tools$254
- Business and industrial$151
- Sporting goods$136
- Electronics$127
- Home and garden$117
- Luggage and bags$105
- Apparel and accessories$103
- Baby and toddler$98
- Arts and hobbies$90
- All stores$79
- Health and beauty$72
- Food and drink$66
- Religious and ceremonial$64
- Pet supplies$63
- Books and media$59
Revenue in US dollars ÷ orders for each store with 5 or more orders, then the median store. Every industry shown has 20 or more stores. Office supplies, toys and games and auto parts are left out: their stores' order values vary too much to give a reliable median.
| Industry | Stores | Average order value | Conversion rate |
|---|---|---|---|
| Furniture | 50+ | $505 | 0.46% |
| Hardware and tools | 40+ | $254 | 0.80% |
| Business and industrial | 50+ | $151 | 1.56% |
| Sporting goods | 250+ | $136 | 1.31% |
| Electronics | 100+ | $127 | 1.26% |
| Home and garden | 500+ | $117 | 1.51% |
| Luggage and bags | 20+ | $105 | 1.61% |
| Apparel and accessories | 700+ | $103 | 1.38% |
| Baby and toddler | 40+ | $98 | 1.49% |
| Arts and hobbies | 60+ | $90 | 1.29% |
| Health and beauty | 2,200+ | $72 | 2.18% |
| Food and drink | 700+ | $66 | 2.33% |
| Religious and ceremonial | 30+ | $64 | 2.36% |
| Pet supplies | 250+ | $63 | 2.33% |
| Books and media | 50+ | $59 | 1.86% |
| All stores | Thousands | $79 | 1.87% |
Order value runs the other way from conversion rate: the industries with the biggest orders convert least. Conversion rate for each industry, and its spread, is in ecommerce conversion rate by industry.
Inside the biggest industries
Health and beauty, apparel, and food and drink hold most of the stores. Supplement stores take bigger orders than skincare and makeup stores, and shoe stores bigger than clothing stores.
| Store type | Industry | Stores | Average order value | Conversion rate |
|---|---|---|---|---|
| Shoes | Apparel and accessories | 70+ | $104 | 1.79% |
| Clothing | Apparel and accessories | 200+ | $98 | 1.54% |
| Health care (supplements, vitamins, wellness) | Health and beauty | 1,100+ | $76 | 2.04% |
| Personal care (skincare, makeup, hair) | Health and beauty | 900+ | $68 | 2.40% |
| Food | Food and drink | 20+ | $68 | 2.38% |
| Drinks | Food and drink | 20+ | $63 | 2.06% |
Within an industry, pricier stores convert about half as often
We split every industry's stores into four equal groups by their order value. The cheapest quarter converts 2.57% of sessions and the priciest quarter 1.38%.
- Cheapest quarter2.57%
- Second quarter2.32%
- Third quarter1.95%
- Priciest quarter1.38%
- Priciest tenth1.10%
Each industry's stores split into quarters by 90-day order value, then pooled. A store needs 30 or more orders in 90 days to be placed.
| Store's average order value | Conversion rate |
|---|---|
| Under $69 | 2.58% |
| $69 to $103 | 2.02% |
| $103 to $174 | 1.53% |
| Over $174 | 0.79% |
So compare your AOV with stores at your price, not only your industry. An apparel store with $150 orders should expect a lower conversion rate than one with $60 orders, and can still earn more per visit.
How to read your own AOV against these numbers
An industry median tells you where you should roughly be. These four checks tell you whether a higher number is worth chasing.
- Work out your AOV over the last 90 days: revenue after discounts and refunds, without tax or shipping, divided by orders.
- Find your industry in the table. Below the median, the cheapest lever is a free-shipping line or a bundle priced a little above it.
- Check revenue per session too, which is conversion rate × AOV. The industries with the biggest orders convert least, so a higher AOV only wins if conversion holds.
- Split it by device. The median store's desktop order is $87 against $77 on a phone, and phones bring about 80% of sessions.
What lifts order value in each industry
One real offer per industry, as it runs in ads today: a bundle, a gift, a set or a free-shipping line set just above the median order.

Health and beauty · median order $72
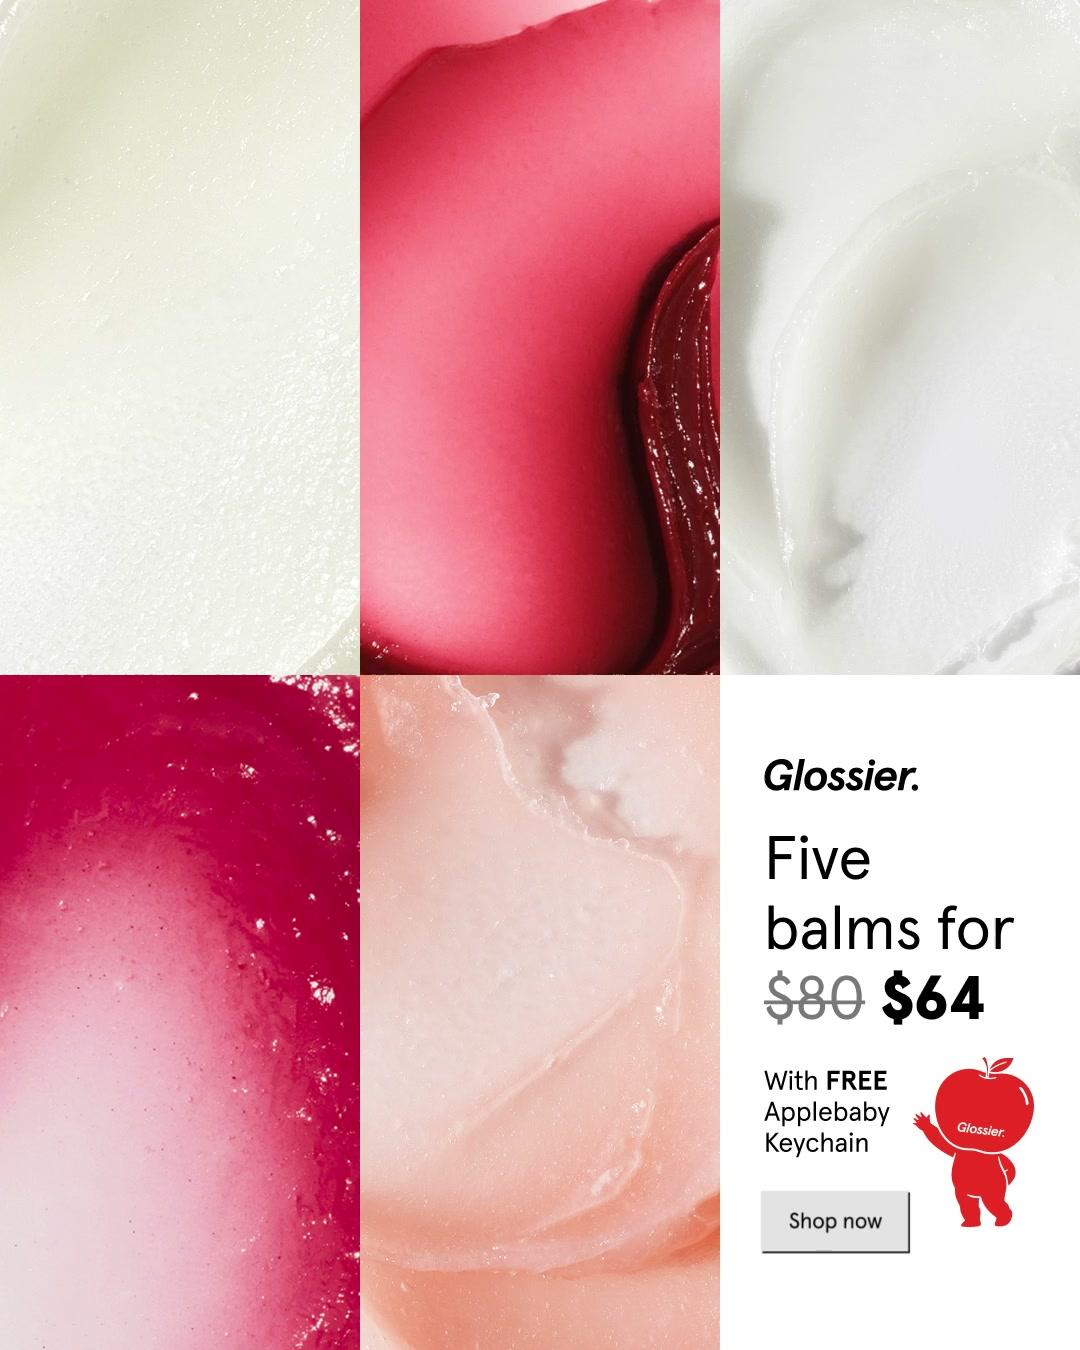
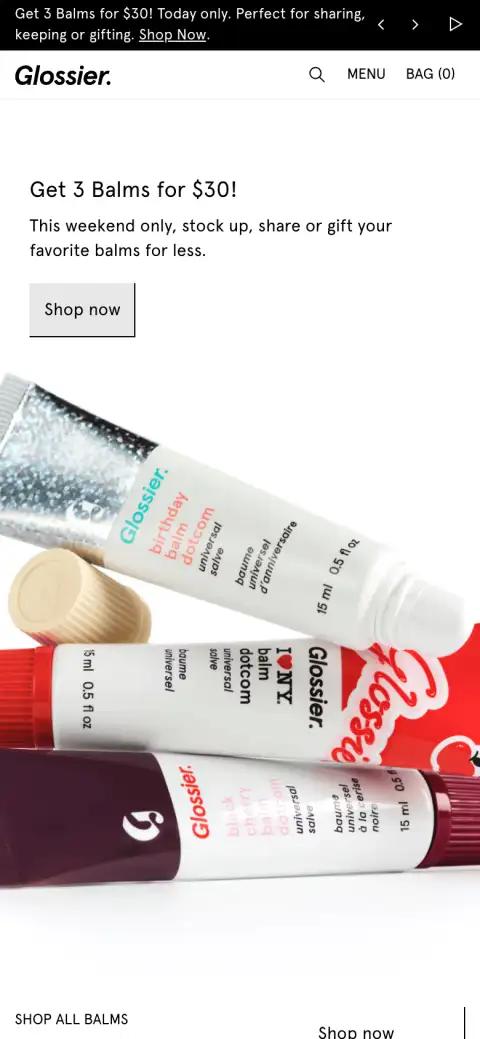
Glossier: a five-pack of one product
Glossier sells five Balm Dotcom lip balms for $64 with a free gift. One order of a product people already reorder lands close to the beauty median of $72.


Supplements · median order $76
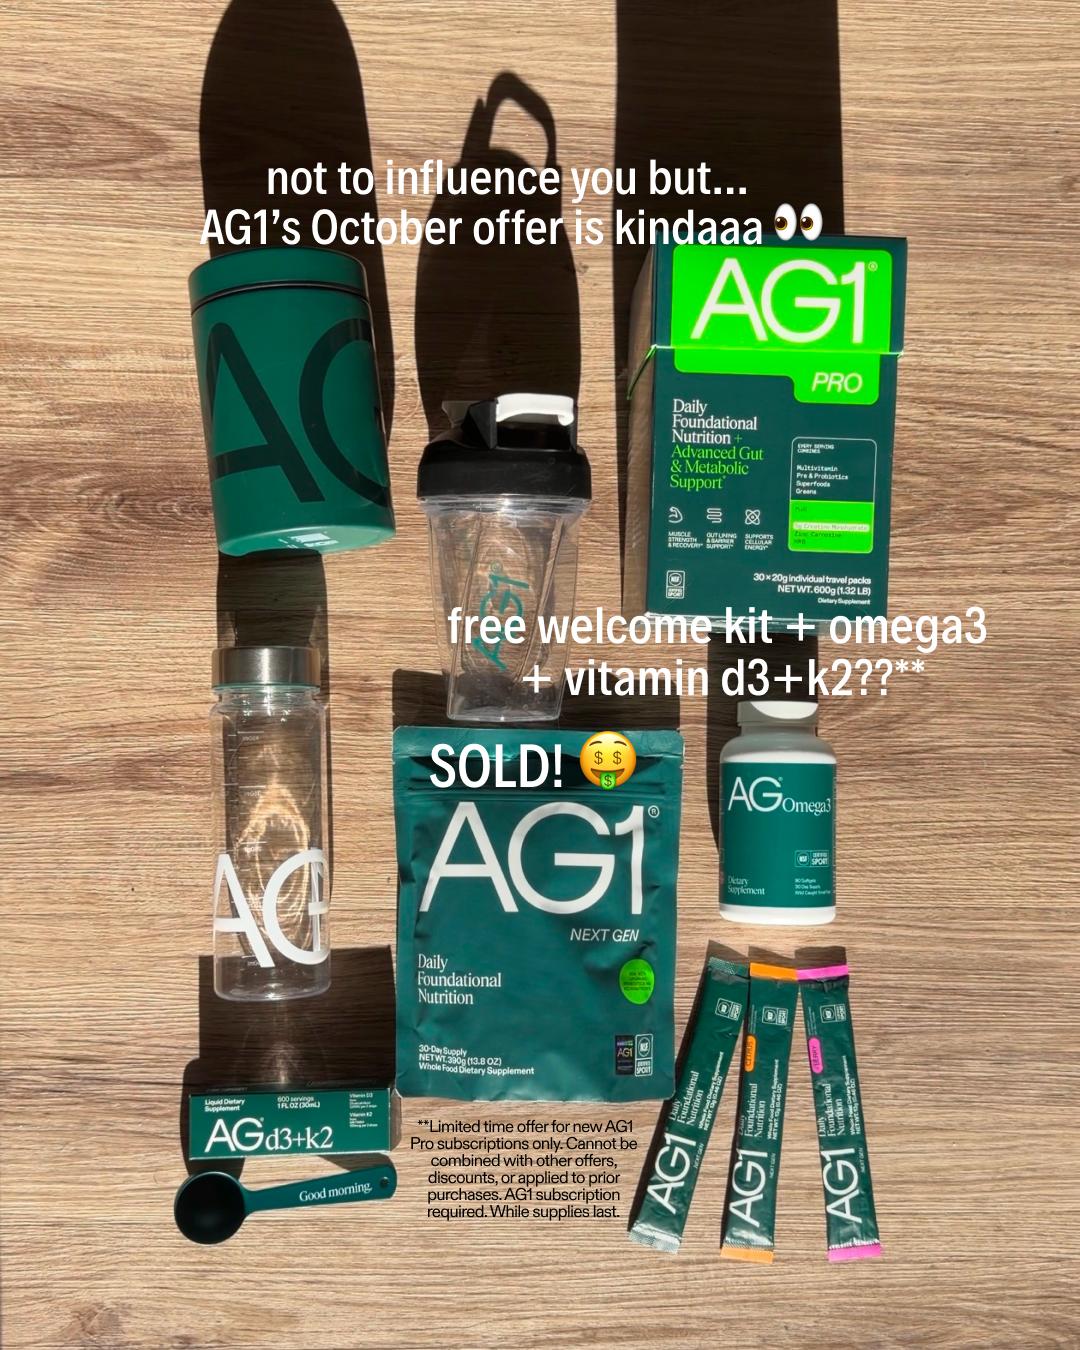
AG1: a free gift worth more than a discount
AG1 gives a $68 bundle of two other supplements with a first subscription order. The gift raises what the first order is worth to the buyer without cutting its price.

AG1
Sponsored ·
🚨LIMITED TIME: FREE $68 IMMUNE SUPPORT BUNDLE🚨** For October, your new AG1 subscription comes with our Immune Support Bundle, AG Omega3 and AG Vitamin D3+K2, on us. Your Welcome Kit is included free too.** ✔️ AG Omega3, FREE** ✔️ AG Vitamin D3+K2, FREE** ✔️ Welcome Kit, FREE** Claim your $68 bundle. **Limited time offer for new AG1 Next Gen and AG1 Pro subscriptions only. Cannot be combined with other offers, discounts, or applied to prior purchases. AG1 subscription required. While supplies last. *These statements have not been evaluated by the Food and Drug Administration. This product is not intended to diagnose, treat, cure or prevent any disease.
drinkag1.com
Free $68 Gift With First Order**
Carousel ad · opens an offer pageSee it in Meta's Ad Library

The page the ad opens

Apparel and shoes · median order $104
OluKai: free shipping just above the median
OluKai's slipper ad offers free shipping on orders of $120 or more. The median shoe store's order is $104, so a line about 15% higher asks for one more small item.



Luggage and bags · median order $105
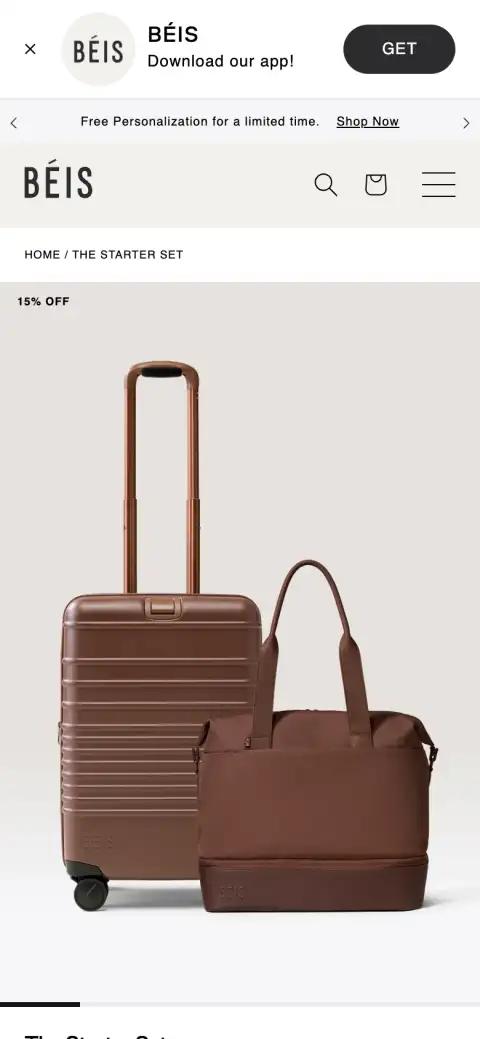
BÉIS: matching sets at a set price
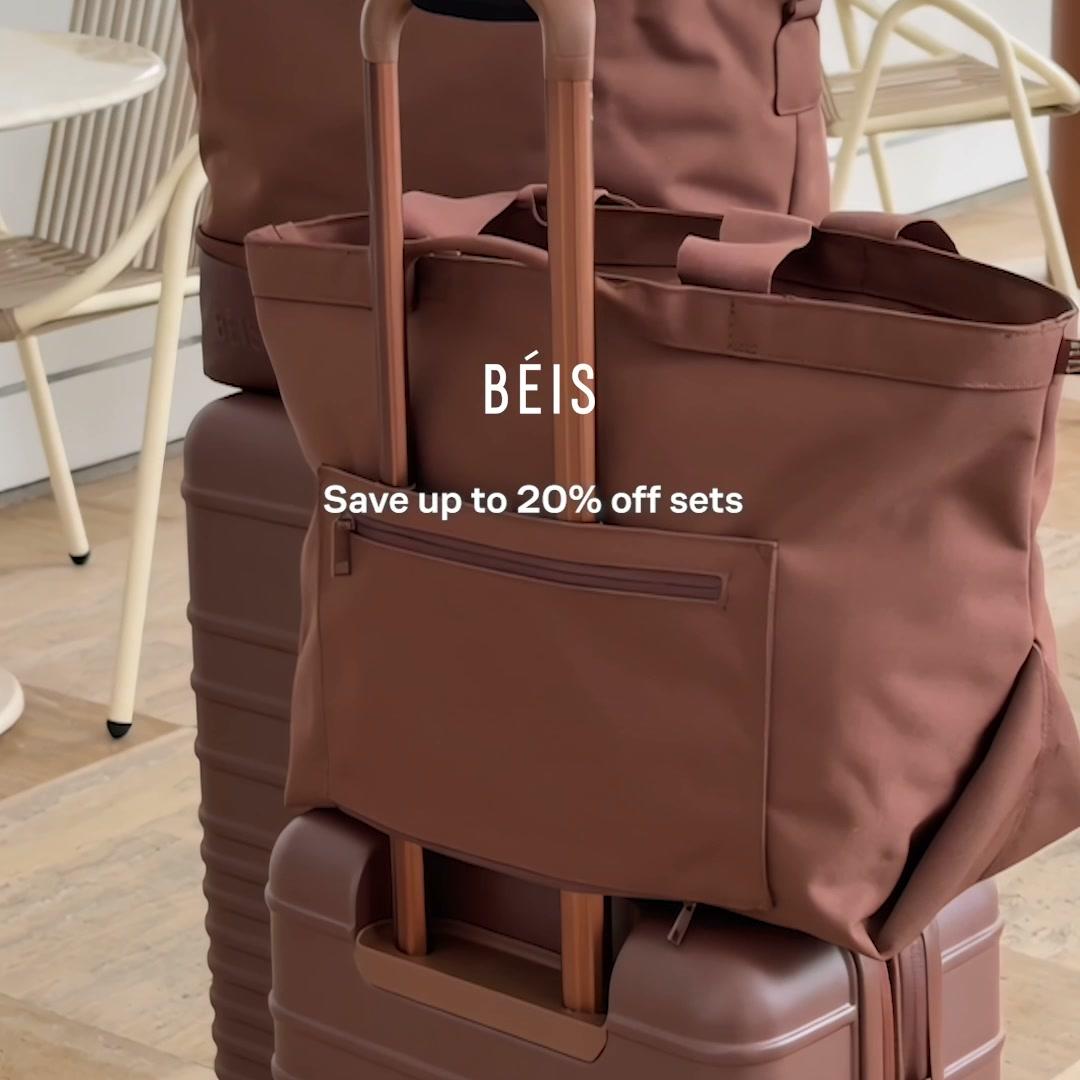
BÉIS takes up to 20% off sets of bags that match. A shopper who came for one bag sees the set first, against a luggage median of $105.

BÉIS
Sponsored ·
Up to 20% off matching sets that travel better together—and look good doing it.
beistravel.com
Up to 20% Off Sets
Video ad · opens a collection pageSee it in Meta's Ad Library
The page the ad opens

Home and garden · median order $117
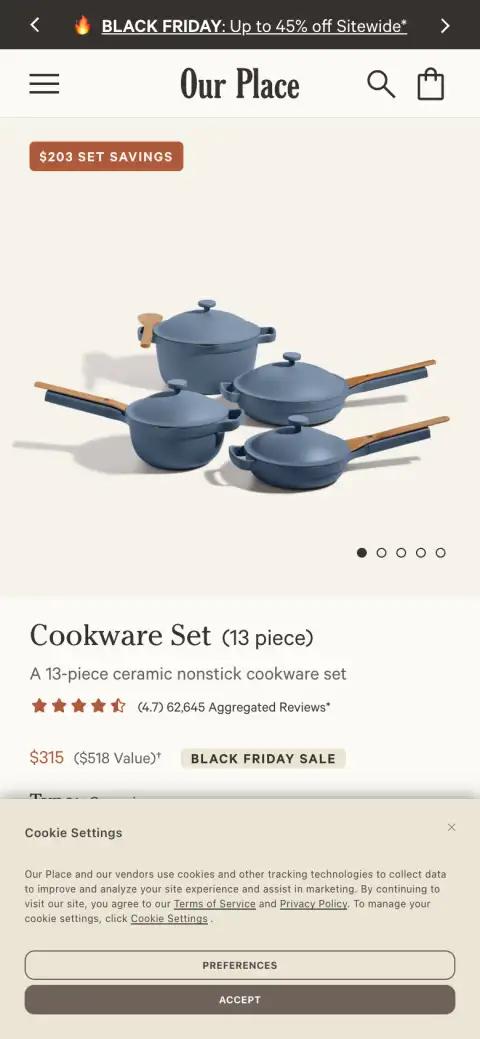
Our Place: a set, plus a shipping line above it
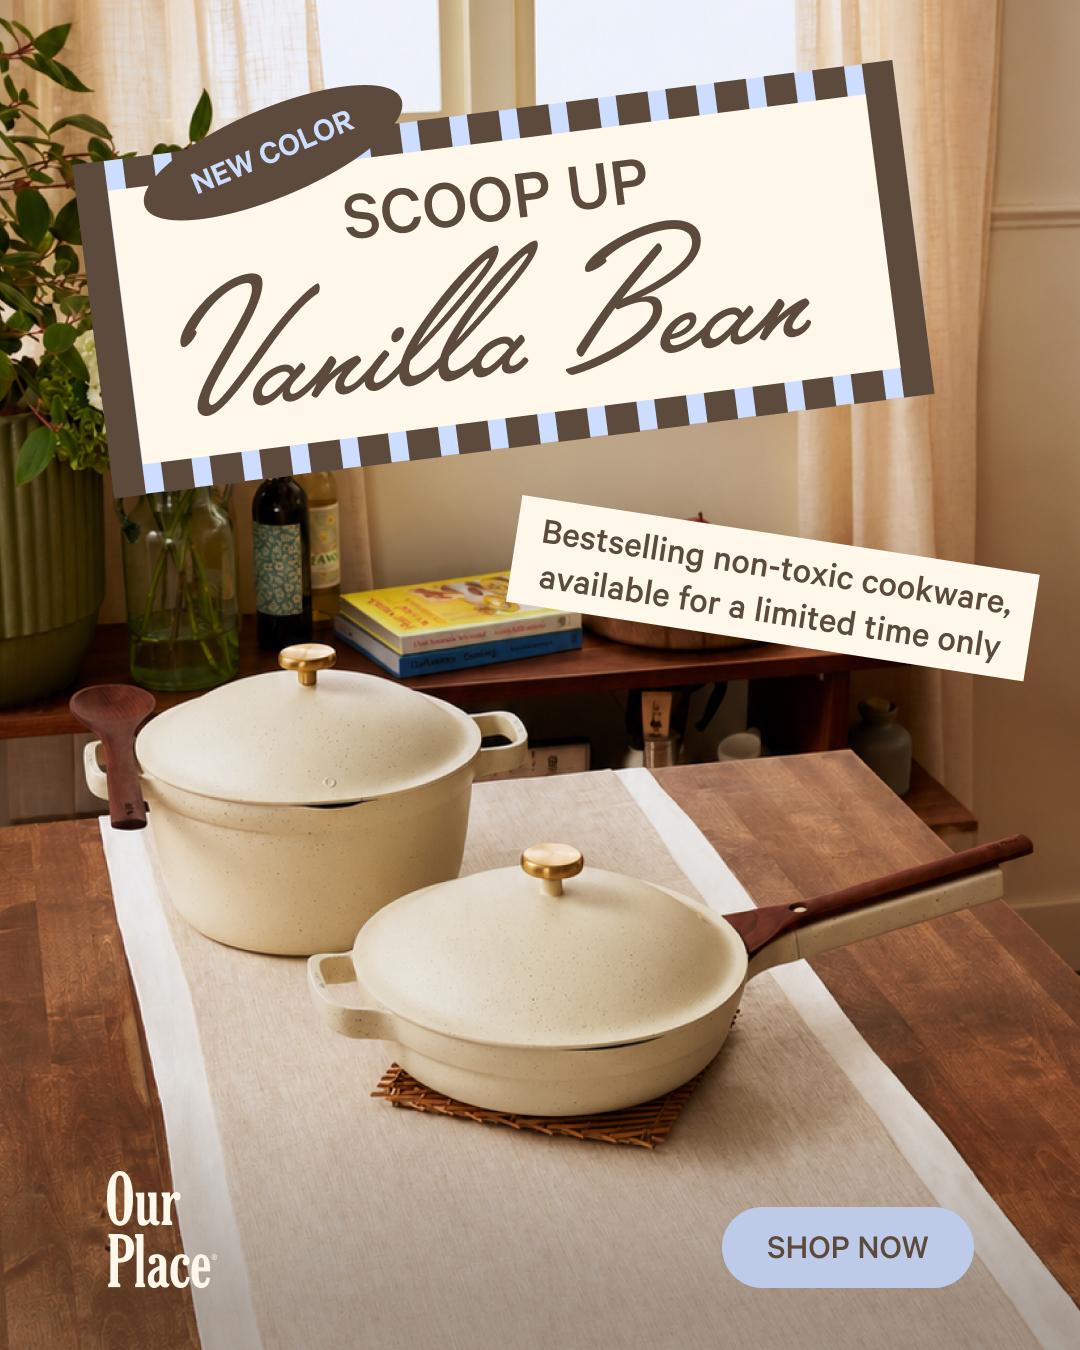
Our Place sells its pans as a matching cookware set and ships free over $135. The home and garden median is $117, so the line sits about 15% above it.

Our Place
Sponsored ·
Meet Vanilla Bean, our newest limited-edition ceramic cookware color. Get your matching cookware set before they sell out. ✔️Non-toxic Thermakind® nonstick ✔️Iconic multifunctional design ✔️Unique speckled finish and champagne gold hardware 🚚Free shipping (over $135) & returns, 100-day trial
fromourplace.com
NEW COLOR! Vanilla Bean is here.
Carousel ad · opens a product pageSee it in Meta's Ad Library
The page the ad opens
Price a bundle before you build it with the bundle pricing calculator, and see more stores doing it in how to increase average order value.
See your own order value by page
Every page Replo publishes reports sessions, orders and revenue, so you can see which page brings the bigger orders.



How we counted
- Stores built on Replo whose pages run Replo's analytics, over the 90 days to November 14, 2026. Stores are never named.
- A store counts once it had 1,000 or more sessions in the window.
- Average order value is revenue in US dollars ÷ orders, per store with 5 or more orders, then the median store.
- Industry is each store's main product category in Shopify's product taxonomy. An industry shows with 20 or more stores.
- An order value shows only when its spread across stores is tight enough to trust.
- Days when a source and device brought 3 times their usual one-page sessions with no add to cart are removed as suspected bots.
Cite this study
Replo, "Average order value by industry," replo.app/reports/average-order-value-by-industry
Link to this page when you quote a number.
More studies: what stores A/B test and how far shoppers scroll. Work out the numbers around order value with the conversion rate calculator and the LTV calculator.